-
药品溶出度试验通常被选作一种体外替代方法为体内生物等效性研究和体内外相关研究提供指导,其中溶出度系指活性药物从片剂、胶囊剂或颗粒剂等普通制剂在规定条件下溶出的速率和程度[1],是片剂质量的重要评价指标。
目前测定溶出度的常用方法主要包括高效液相色谱(HPLC)法与紫外-可见分光光度(UV-vis)法等。近红外光谱技术具有分析速度快、产出多;不破坏样品、不污染环境;操作技术要求低等优点[2],其结合化学计量学已被广泛应用于样品的定性定量分析,在实时检测片剂溶出过程的溶出度亦得到了应用[3],部分报道表明根据片剂近红外光谱可预测其溶出度或溶出行为[4-6]。
第二代抗精神病药阿立哌唑片是临床治疗精神分裂症的常用药,其具有低溶解性与高渗透性,依据生物药剂学分类系统(biopharmaceutical classification system, BCS)判断,阿立哌唑片为BCS2类口服固体制剂,测定其溶出行为对于体内生物等效的研究具有重要意义。为提高药品生产效率,本文通过建立不同主成分含量的阿立哌唑片剂近红外光谱和溶出行为的模型,探讨以片剂近红外光谱预测其溶出度的可行性,为建立药品整体质量在线监测系统提供研究基础。
-
Bruker MPA Ⅱ近红外光谱仪(Bruker公司,德国);SOTAX AT 7smart溶出仪(SOTAX公司,瑞士);TQ Analyst 9.7软件(Thermo Fisher公司,美国);MATLAB R2014a(Math Works公司,美国)。
-
阿立哌唑对照品(纯度:99.9%,批号:100776-201302,中国食品药品检定研究院);盐酸、氯化钾(均购自国药集团化学试剂有限公司)。
-
制备7批不同含量(含量分别为标示量的84.60%、90.24%、95.88%、100.0%、101.5%、107.2%、112.8%,标示量为5 mg)的阿立哌唑粉末,每批取2组各60 g粉末进行压片。另取本实验室之前制备的6批100 %标示量的阿立哌唑粉末,每批取1组约60 g粉末进行压片。每组粉末压片时,在压片机稳定运行后随机取6片,共得到120个阿立哌唑片样品,并依次编号为1~120。
-
将Bruker MPA Ⅱ近红外光谱仪的光纤探头对准阿立哌唑片的表面采集近红外光谱,样品扫描次数为32次,光谱采集范围为4 000.00~12 000.00 cm−1,分辨率为8 cm−1,同时,每半小时采集一次聚苯乙烯标准品完成光谱仪的校正。
-
取阿立哌唑片,按照溶出度与释放度测定法(《中国药典》 2020版通则0931第二法),以900 ml盐酸-氯化钾缓冲液为溶出介质,转速为60 r/min,依法操作。以SOTAX AT 7smart溶出仪分别于第3、6、9、12、15、30 min自动取样测定溶出度,即根据Lambert-Beer定律,计算得各时间点溶液样品中阿立哌唑浓度(研究中以阿立哌唑对照溶液确定其255 nm波长处吸光系数
$ {E}_{1\mathrm{c}\mathrm{m}}^{1\text{%}} $ 为1 261.81),进而计算溶出度。 -
偏最小二乘法(PLS)建立多变量的定量模型有两种方法[7],一是用PLS1算法建立模型,可以针对每个时间点的溶出度做一个定量模型;二是运用PLS2算法建立模型,可以同时预测不同时间点的溶出度。为能够一次性得到片剂的溶出行为相关参数,本研究选取PLS2算法建立阿立哌唑片溶出度预测模型。
-
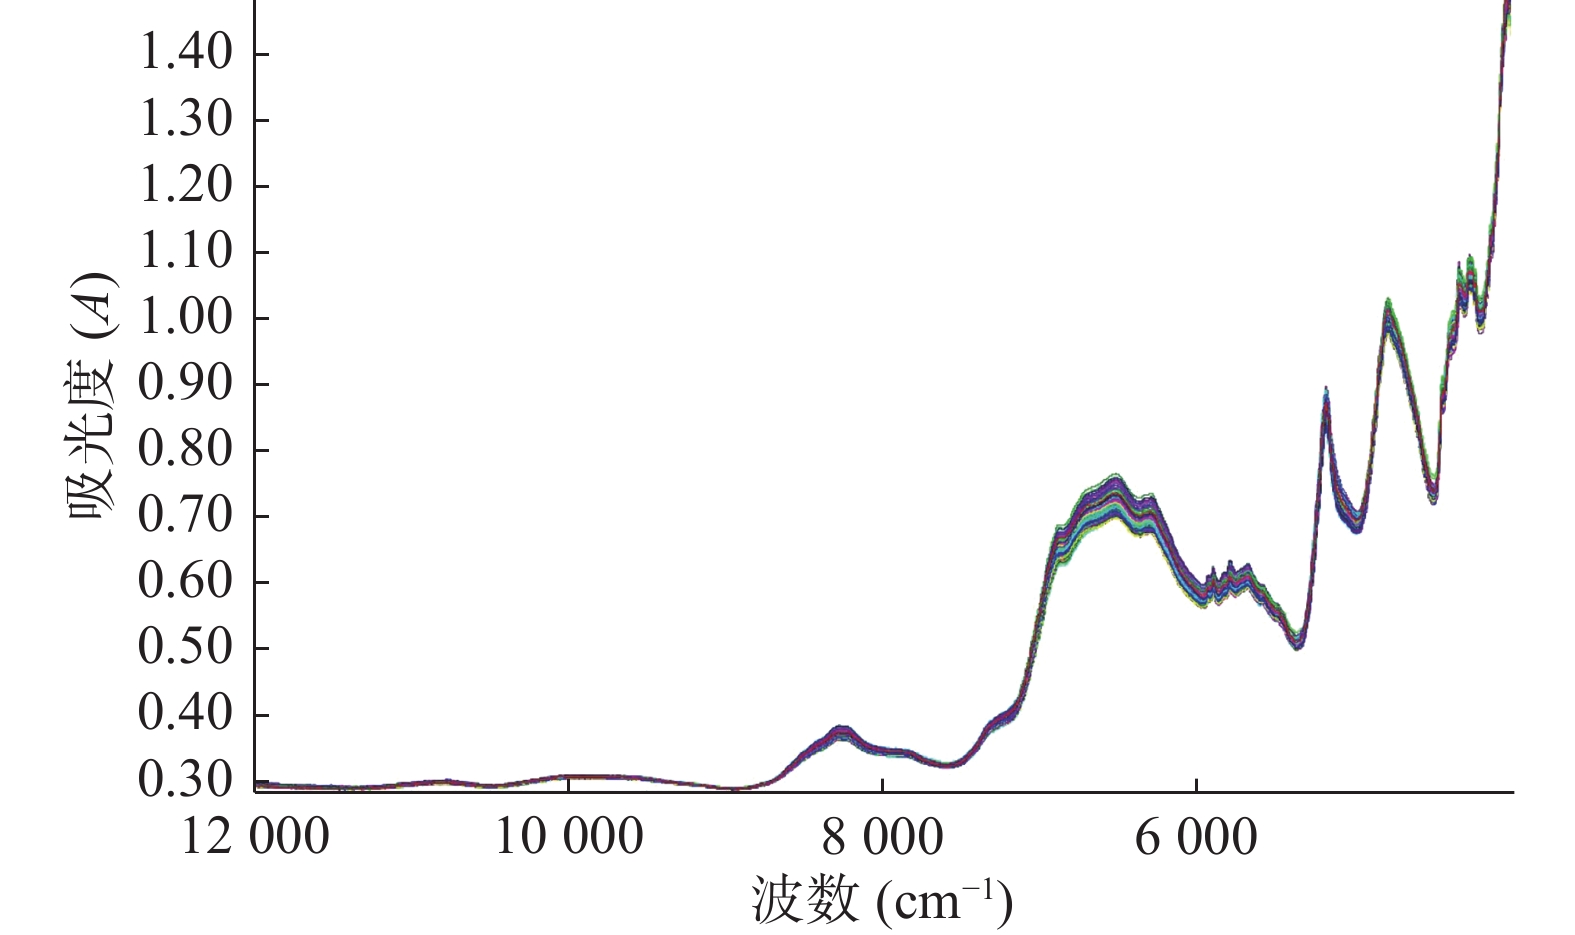
以Bruker MPA Ⅱ近红外光谱仪分别采集了120片阿立哌唑片的近红外光谱图(依次随机编号为1,2,···,120),结果如图1所示。
-
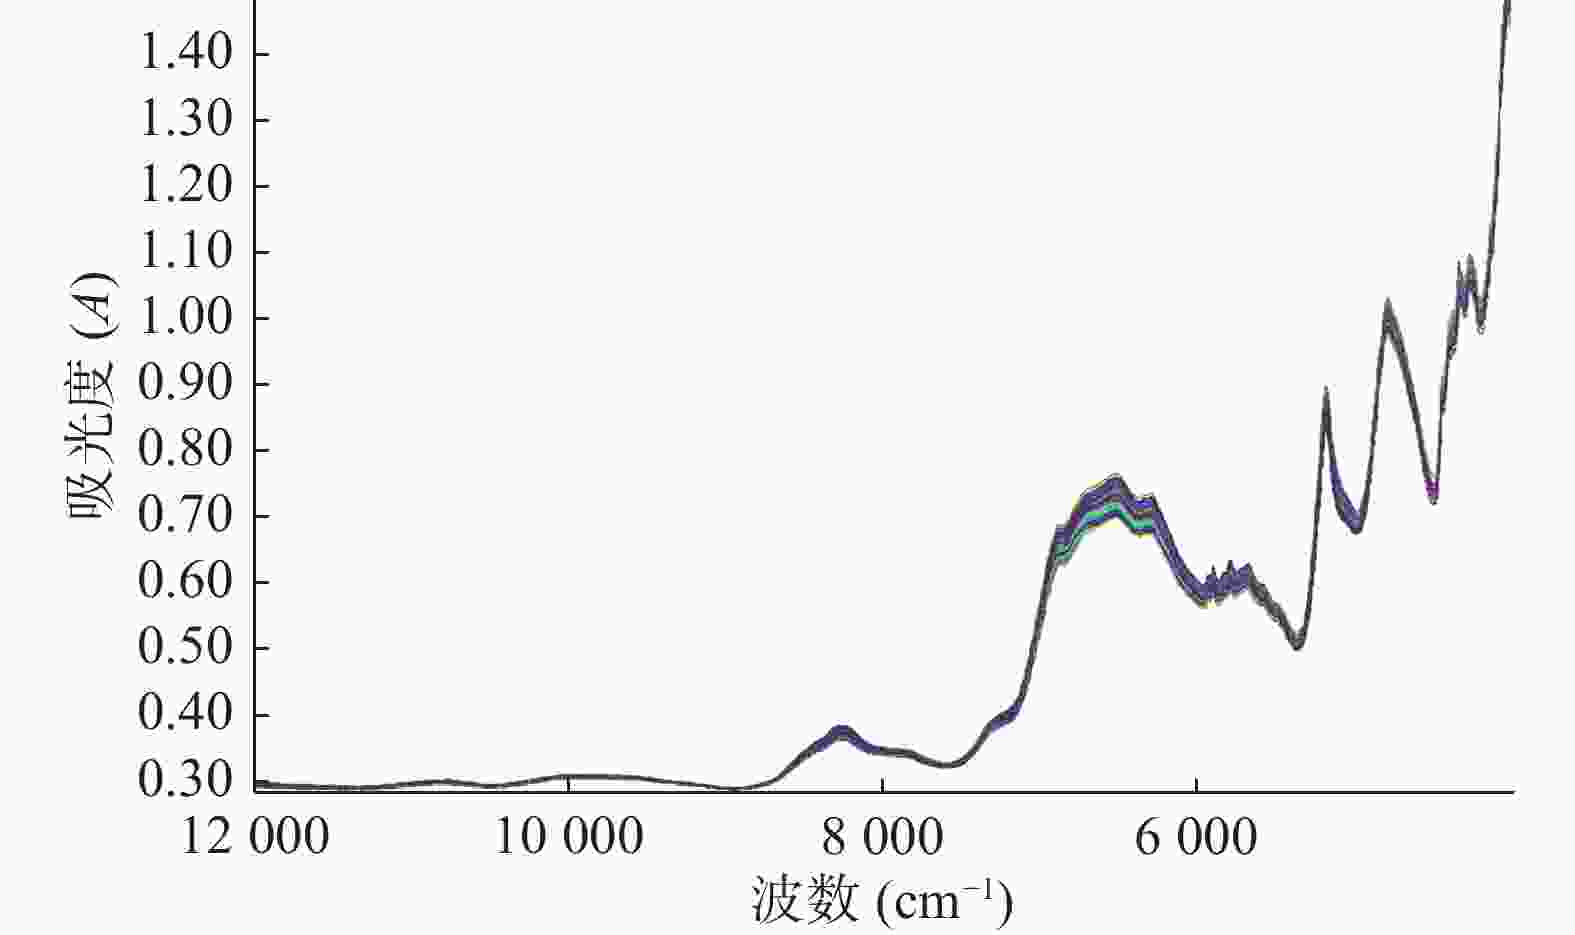
计算样品光谱的马氏距离,使用Chauvenet检验判断光谱异常样本,再根据杠杆值和学生化残差剔除化学值异常样本。根据Chauvenet检验剔除编号为81、94、109的光谱异常样本。根据杠杆值在± 3k/n(k为主因子数,n为样本数)之间和学生化残差在± 2之间[8]对每个时间点溶出度进行考察,应剔除的化学值异常样本如表1所示。根据化学值异常样本出现频率,出现3次及以上判断为整个模型的异常样本并将其剔除,最终剔除编号为22、52、56、78、79的样本。
溶出时间点(t/min) 样品编号 3 16 22 44 79 6 3 4 45 56 71 85 103 107 108 9 7 21 52 56 78 12 22 32 52 56 15 21 52 56 58 78 79 30 7 22 52 56 78 79 -
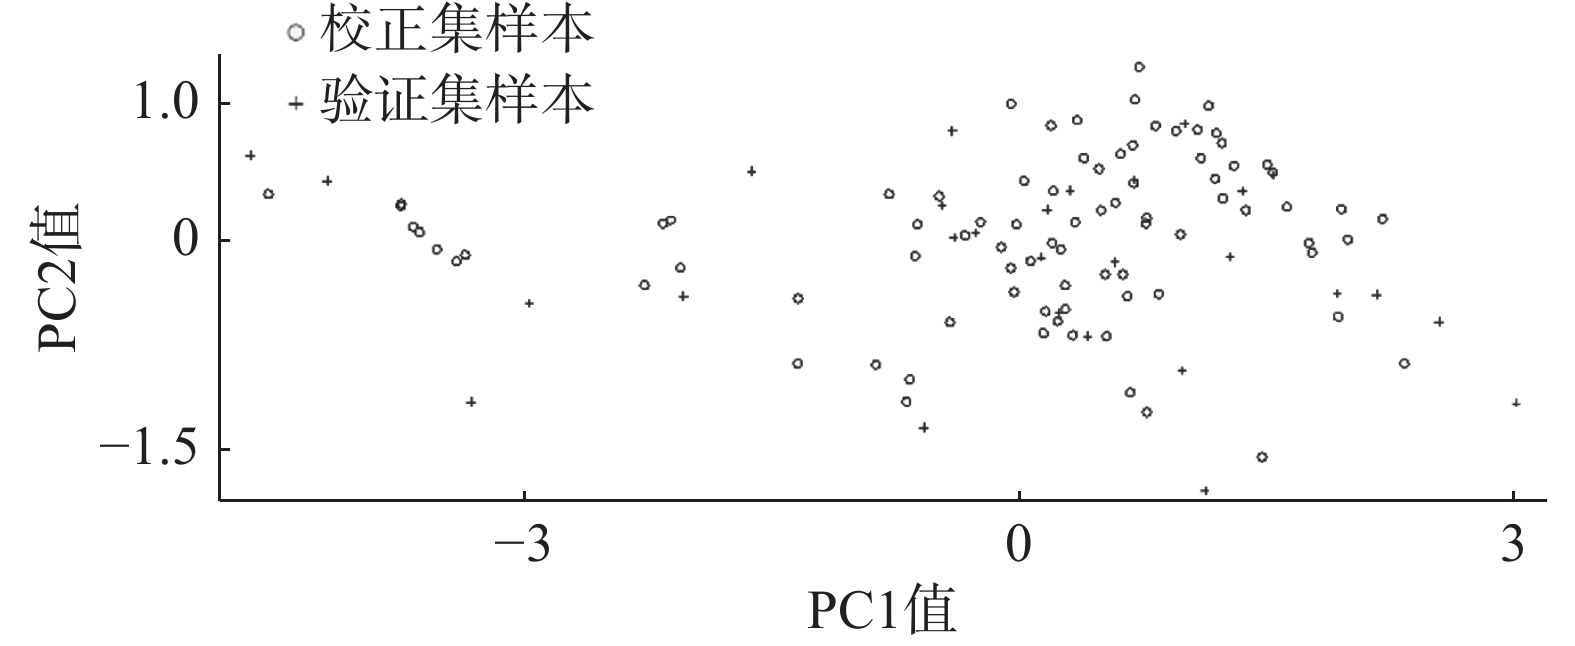
依据“2.5.2”项下剔除8个异常样本后,采取可兼顾光谱和化学值特征的SPXY (sample set partitioning based on joint X-Y distances)法对剩余112个样本进行校正集和验证集的划分。根据校正集:验证集=3:1的比例将84个样本分为校正集,28个样本分为验证集,并对112个样本进行主成分分析。结果可见,验证集样本均匀分布于校正集中(图2)。
-
TQ Analyst 9.7软件提供了多元散射校正(MSC)、标准正态变换(SNV)等的光谱散射校正处理方法;导数计算的光谱背景扣除方法;以及savitzky-golay卷积平滑(S-G)、norris derivative平滑(N)的光谱平滑滤噪方法。研究中采用TQ Analyst 9.7分别以各种方法进行光谱预处理(部分结果见表2),由结果可见,上述方法中以卷积平滑(S-G)处理方法预处理阿立哌唑片近红外分析光谱效果最好。
预处理方法 3 min 30 min RMSEC
(%)RC RMSEP
(%)RP RMSEC
(%)RC RMSEP
(%)RP NO 5.30 0.980 0 7.69 0.955 9 1.11 0.990 6 2.71 0.960 0 S-G 5.39 0.979 3 7.73 0.955 4 0.86 0.994 3 2.47 0.967 6 1st Derivative 2.88 0.994 1 14.60 0.846 0 0.34 0.999 1 2.33 0.965 8 1st Derivative +S-G 2.76 0.994 6 13.30 0.866 6 0.35 0.999 1 2.45 0.963 7 1st Derivative +N 5.09 0.981 5 9.45 0.933 9 1.06 0.991 3 2.89 0.955 4 2nd Derivative 7.66 0.957 7 21.70 0.644 8 0.67 0.996 5 2.87 0.948 7 2nd Derivative +S-G 2.49 0.995 6 19.10 0.712 5 0.33 0.999 2 2.87 0.950 5 2nd Derivative +N 4.67 0.984 5 17.30 0.793 1 0.43 0.999 6 3.28 0.943 2 MSC 5.73 0.976 6 8.26 0.947 8 1.19 0.989 2 2.92 0.954 0 MSC+S-G 5.42 0.979 1 8.24 0.948 5 1.17 0.989 4 2.81 0.956 8 MSC+1st Derivative 3.73 0.990 1 10.20 0.921 1 0.33 0.999 1 2.77 0.949 6 MSC+1st Derivative +S-G 2.53 0.995 5 9.54 0.933 7 0.41 0.998 7 2.83 0.948 6 MSC+1st Derivative +N 4.81 0.983 6 8.01 0.951 7 0.94 0.993 3 3.18 0.946 3 MSC+2nd Derivative 5.83 0.975 7 20.50 0.614 2 0.71 0.996 1 2.80 0.950 1 MSC+2nd Derivative +S-G 2.04 0.997 1 16.00 0.790 3 0.33 0.999 1 2.90 0.948 2 MSC+2nd Derivative +N 6.30 0.971 6 11.30 0.909 3 0.40 0.998 8 3.50 0.931 1 SNV 5.72 0.976 6 8.25 0.948 0 1.18 0.989 3 2.92 0.954 0 SNV+S-G 5.41 0.979 1 8.22 0.948 8 1.16 0.989 6 2.81 0.956 8 SNV+1st Derivative 3.72 0.990 2 10.10 0.921 6 0.33 0.999 1 2.77 0.949 7 SNV+1st Derivative +S-G 2.53 0.995 5 9.51 0.934 2 0.41 0.998 7 2.82 0.948 7 SNV+1st Derivative +N 4.81 0.983 6 7.99 0.951 8 0.94 0.993 3 3.18 0.946 5 SNV+2nd Derivative 5.83 0.975 7 20.50 0.614 1 0.71 0.996 1 2.80 0.950 1 SNV+2nd Derivative +S-G 2.04 0.997 1 16.00 0.790 6 0.33 0.999 1 2.90 0.948 2 SNV+2nd Derivative +N 6.31 0.971 5 11.30 0.9095 0.40 0.9988 3.50 0.9312 注:RMSEC指校正均方根误差;RMSEP指预测均方根误差;S-G指卷积平滑;N指平滑;MSC指多元散射校正;SNV指标准正态变换。 -
研究中分别使用TQ Analyst 9.7软件推荐法、皮尔森相关系数法和全波段法3种方法选择建模波段。
TQ软件推荐法:TQ软件提供建模波段推荐的功能,提供的波段范围为3 999.64~4 925.30、5 257.00~10 795.56 cm−1。
皮尔森相关系数法:将光谱所有波段与阿立哌唑片3、6、9、12、15、30 min时的溶出度进行相关性计算,得到每个波段与含量的相关系数。相关系数绝对值大于等于0.3时认为该波段与含量相关[9],最终选择均大于等于0.5的波段(4 000.00~4 396.90、5 326.43~12 000.00 cm−1)参与比较。
全波段法:选择Bruker MPA Ⅱ近红外光谱仪采集的波段范围(4 000.00~12 000.00 cm−1)作为建模波段,为表述方便,本文将这一波段称为全波段。比较3种方法(结果见表3,列举了3 min和30 min这两个时间点溶出度模型参数),选择波段4 000.00~4 396.90、5 326.43~12 000.00 cm−1建立的模型总体RMSEP最小,RP最高。
波段选择方法 建模波段(cm−1) 3 min 30 min RMSEC
(%)RC RMSEP
(%)RP RMSEC
(%)RC RMSEP
(%)RP TQ软件推荐法 3 999.64~4 925.30
5 257.00~10 795.566.37 0.971 0 8.35 0.947 7 0.71 0.996 1 2.50 0.970 4 皮尔森相关系数法 4 300.48~4 423.90 6.03 0.974 0 7.95 0.952 7 0.73 0.995 9 2.33 0.976 8 全波段 4 000.00~12 000.00 5.39 0.979 3 7.73 0.955 4 0.86 0.994 3 2.47 0.967 6 注:RMSEC指校正均方根误差;RMSEP指预测均方根误差。 -
运用PLS2算法,根据马氏距离和杠杆值-学生化残差剔除异常样本后用SPXY法划分样本集,选择最佳的光谱预处理方法(S-G平滑)和建模波段(4 000.00~4 396.90、5 326.43~12 000.00 cm−1)建立阿立哌唑片溶出行为模型,模型参数如表4所示。
溶出时点(t/min) RMSEC(%) RC RMSEP(%) RP 3 6.03 0.974 8 7.95 0.952 7 6 3.37 0.956 1 7.02 0.852 1 9 1.21 0.989 1 2.49 0.967 3 12 0.80 0.995 1 2.53 0.970 7 15 0.73 0.995 9 2.42 0.973 5 30 0.73 0.995 9 2.33 0.976 8 注:RMSEC指校正均方根误差;RMSEP指预测均方根误差。 由表4中可见,光谱与各时间点溶出度相关性普遍较高。使用模型分别对另外制备的其他5片阿立哌唑片进行单片溶出行为预测,结果3、6、9 、12、15、30 min时的RMSEP分别为16.45、5.75、3.50、2.42、2.32、2.35(表5)。对每个时间点的实际溶出度和预测溶出度进行配对样本t检验,置信区间为95 %,检验结果P值分别为0.603、0.901、0.225、0.692、0.616、0.438,均大于0.05,预测溶出度和实际溶出度之间没有显著差异。但是从表中可以看出,3 min时的RMSEP比较大,随着溶出时间的增加,模型预测误差逐渐减小。
溶出时间点(t/min) 模型预测/实际溶出度(%) 3 89.04/
105.1887.01/
100.8087.23/
103.0197.55/
99.63114.20/
88.746 105.40/
105.2696.29/
102.4197.78/
103.60111.44/
104.33103.57/
105.209 103.57/
105.2097.50/
102.8098.52/
103.41106.00/
106.82106.93/
104.4912 103.85/
105.1498.88/
102.78101.73/
103.39108.62/
106.79106.85/
104.3515 103.76/
105.1899.26/
102.80101.37/
103.39108.22/
106.84106.92/
104.3730 103.61/
105.2199.14/
103.15101.67/
103.59107.79/
107.07106.77/
104.60注:表中的数据分别为单片阿立哌唑的模型预测与实际测定的溶出度比较。 -
本研究采集了阿立哌唑片剂近红外光谱,依法进行溶出度试验以分别测定每一片的溶出行为参数,采取卷积平滑方法预处理波段4 000.00~4 396.90、5 326.43~12 000.00 cm−1的近红外光谱,以PLS2算法建立了阿立哌唑片剂溶出行为模型,不同时间点的RC和RP均在0.95以上(除6 min的RP)。由于PLS2算法对每个时间点的小模型的预测样本集、光谱预处理方法和波段都相同,对整个模型而言效果最佳,但可能导致具体到单个小模型并非最佳,如时间点6 min的RP较小。本文建立的阿立哌唑片溶出行为预测模型可同时对阿立哌唑片溶出3、6、9、12、15、30 min时的溶出度进行预测。从结果看,3 min和6 min的溶出度预测 误差较大,这可能是在溶解初期,含量、片剂硬度、原辅料组成成分和形式等因素都在对溶出度产生影响,各因素的影响程度都较大[10]。而在溶解中期,即溶出6~15 min时,影响溶出行为的因素逐渐转为含量主导,模型相关系数增大,预测误差减小,展现出较好的预测能力。从溶出数据上可以看出,15 min和30 min两个时间点的溶出度几乎相同,在模型中也可以看出两个时间点的模型参数很接近,这是因为阿立哌唑片在15 min后基本已经完全溶出。目前,模型在预测最终溶出度上得到了较为可信的数据,但影响溶出度的因素还有很多,后续仍需增加其他因素差异的片剂优化模型,如相同含量不同硬度的片剂、不同阿立哌唑原料药晶型的片剂等。另外,对于溶出初期预测效果差的问题也需要进行更加深入的分析研究。
本文初步证明了通过片剂近红外光谱预测溶出行为的可行性,这提示研究工作者在压片过程中可以出片口处在线采集片剂的近红外光谱,通过溶出度预测模型预判每片的溶出度是否合格、溶出行为是否合理,节约检测成本,简化放行程序,提高药品生产效率,便于及时分析原因以减少损失。
Dissolution behavior of aripiprazole tablets based on near infrared spectroscopy
doi: 10.12206/j.issn.2097-2024.202108066
- Received Date: 2021-08-15
- Rev Recd Date: 2022-01-10
- Available Online: 2023-07-14
- Publish Date: 2023-01-25
-
Key words:
- near infrared spectroscopy /
- aripiprazole tablets /
- dissolution
Abstract:
| Citation: | WANG Weiqing, YANG Wen, LU Feng. Dissolution behavior of aripiprazole tablets based on near infrared spectroscopy[J]. Journal of Pharmaceutical Practice and Service, 2023, 41(1): 36-39, 62. doi: 10.12206/j.issn.2097-2024.202108066 |


 DownLoad:
